Commercial Energy Audit Report Breakdown. What You Actually Receive
When people ask for an energy audit, what they usually want is clarity.
Not a technical document.
Not 80 pages of engineering commentary.
They want to know:
Where is the energy going
What is it costing
What can be fixed
What it will cost to fix
What the return looks like
What should be done first
This is what a properly structured energy audit report delivers.
Under AS/NZS 3598, both Type 2 and Type 3 audits follow a defined structure. The depth changes, but the purpose does not. The report must support decisions.
Below is what decision makers actually use from a commercial energy audit report
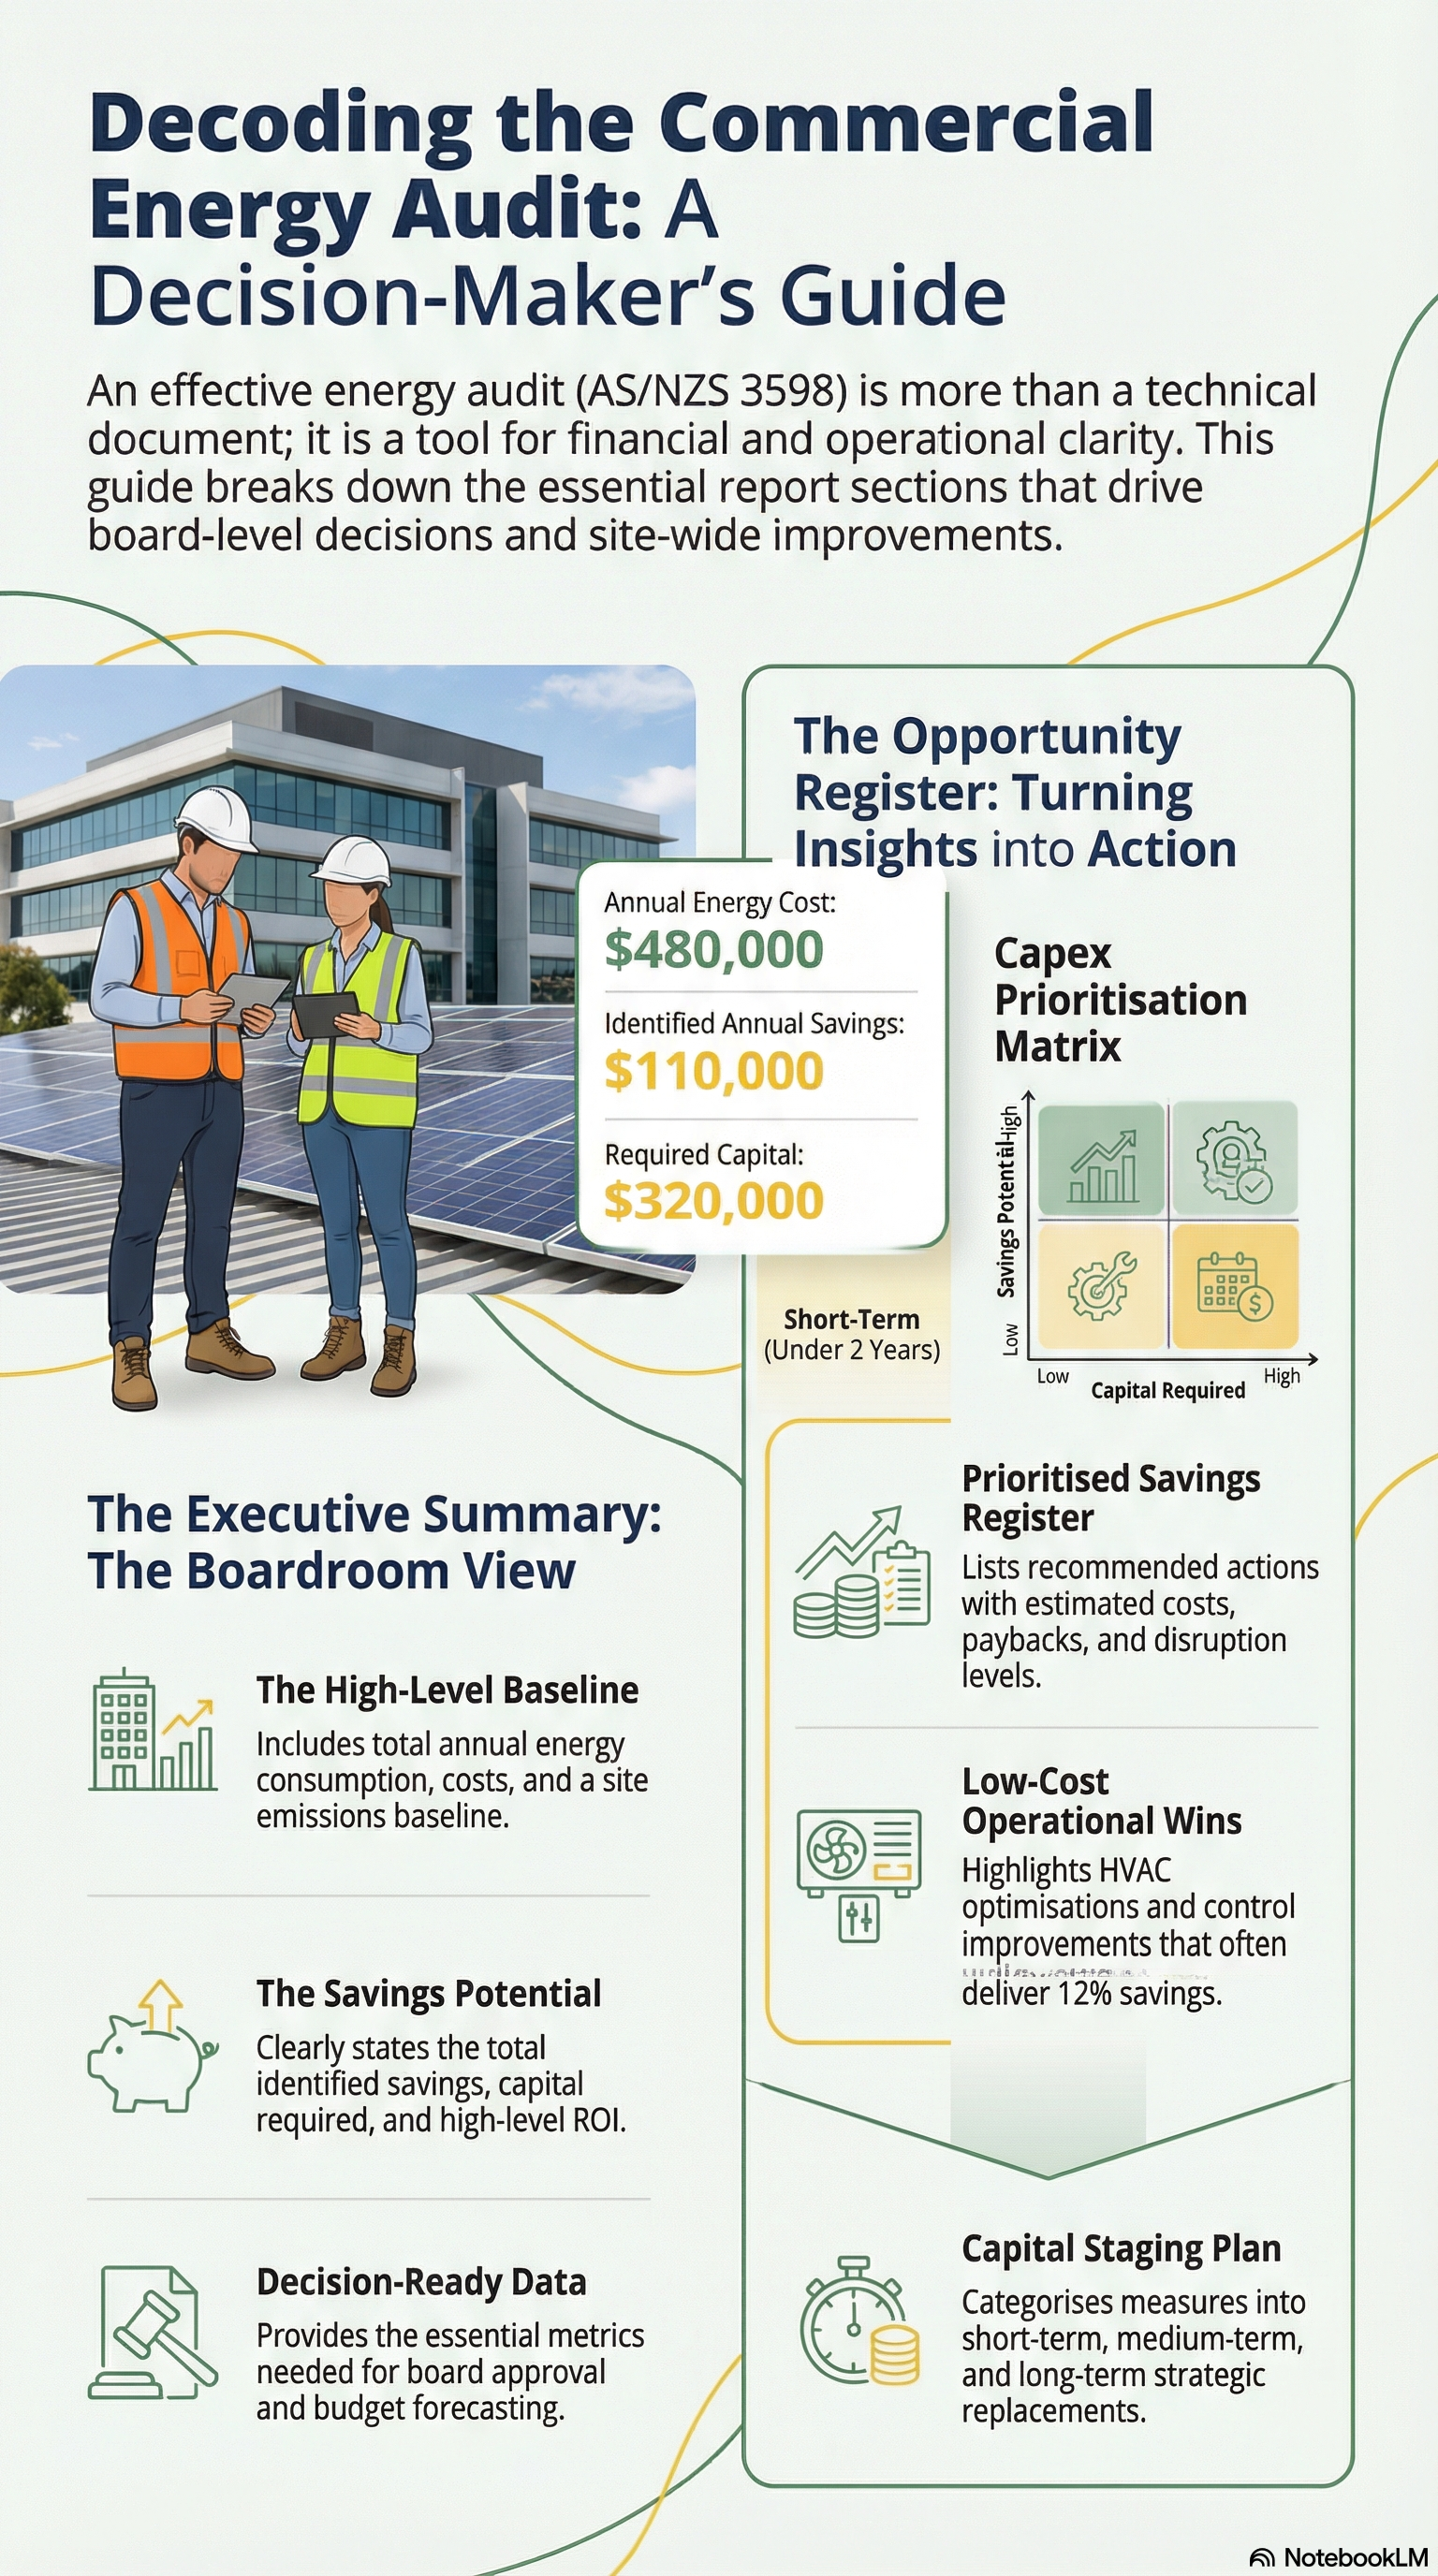
Executive Summary. The Page That Gets Read First
For a CFO or Asset Manager, this is the most important section.
A strong executive summary includes:
Total annual energy consumption by fuel
Total annual energy cost
Site emissions baseline
Number of opportunities identified
Total potential savings
Capital required
Simple payback and high-level ROI
In many cases, this summary is what goes to the board.
If this page is unclear, the rest of the report will not be used.
Energy Baseline and Load Profile Analysis
This section explains how the site actually consumes energy.
It typically includes:
12 to 24 months of electricity and gas data
Seasonal demand variation
Peak demand drivers
After-hours base load
Weekend and shutdown performance
On real sites, this is where operational issues become visible. Common findings include:
HVAC running outside required hours
Compressed air left online during shutdown
Simultaneous heating and cooling
Excessive base load in office buildings
Demand spikes caused by plant sequencing
This is the point where Facility Managers recognise their site in the data.
System Breakdown by Major Load
Under AS/NZS 3598, the report must identify significant energy users.
This section usually breaks energy into:
HVAC plant
Lighting
Process loads
Refrigeration
Compressed air
Pumps and fans
Hot water systems
In a Type 2 audit, this breakdown is based on site inspection, nameplate data, runtime assumptions, and interval data.
In a Type 3 audit, this may include deeper modelling, metering validation, and engineering calculations.
For Operations Managers, this is where reliability risk often becomes clear. Ageing chillers, oversized compressors, or inefficient boilers show up not just as cost issues, but as operational exposure.
Energy Conservation Measures. The Most Used Section
This is the working tool.
A properly structured opportunity register includes:
Stronger financial analysis and more granular data-based review of key energy-consuming equipment.
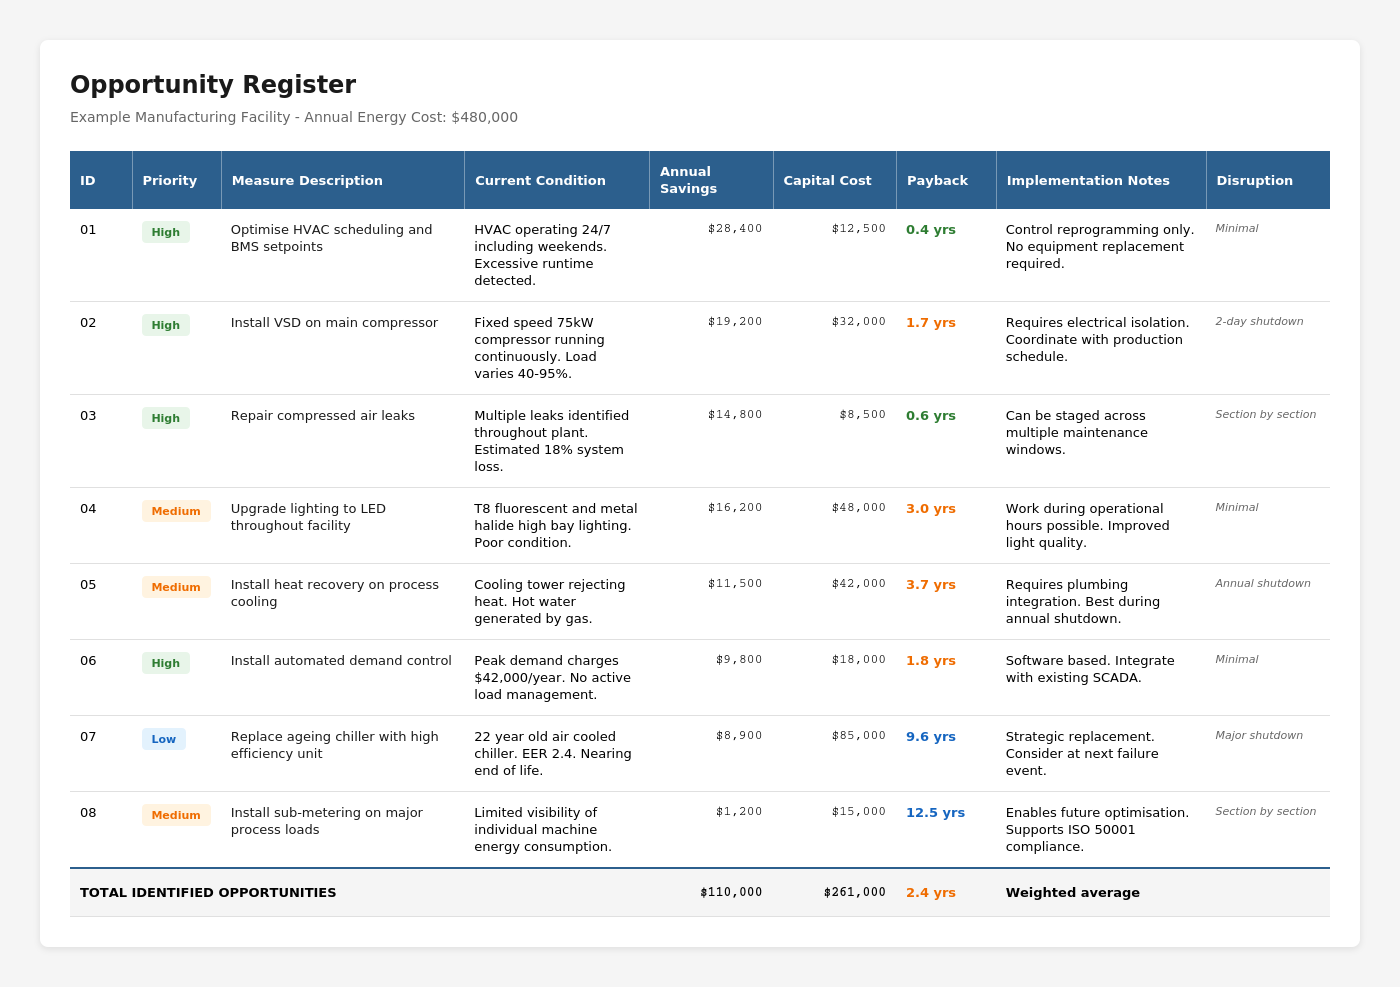
This register becomes the internal action list.
Facility teams use it for planning shutdown work.
CFOs use it for budget forecasting.
Asset Managers use it for capital prioritisation.
Without this structured table, the report becomes reference material rather than a decision tool.
Capital Prioritisation and Staging
Decision makers rarely implement everything at once.
A good audit report separates measures into:
Low-cost operational improvements
Mid-range optimisation upgrades
Capital-intensive plant replacements
Capital-intensive plant replacements
Often presented as:
Short term. Under 2-year payback
Medium term. 2 to 5 years
Long term. Strategic asset replacement
This staged approach recognises real site constraints:
Budget cycles
Contractor availability
Shutdown windows
Procurement processes
Asset replacement timing
This is where the audit shifts from theory to implementation planning.
Financial Analysis. What Makes It Board Ready
Because this article references AS/NZS 3598, the financial treatment differs between Type 2 and Type 3 audits.
Type 2 audits generally provide:
Indicative capital cost estimates
Simple payback
High-level ROI
Type 3 audits go further, often including:
Discounted cash flow
Net Present Value
Internal Rate of Return
Sensitivity analysis
For typical clients, large commercial and industrial energy users, the blended approach works well.
Provide sufficient financial rigour to build confidence in decisions, but avoid excessive modelling that delays action.
Indicative Example
Indicative example based on a typical commercial audit scope:
Annual energy cost is approximately $480,000
Identified savings potential of approximately $110,000 per year
Required capital is approximately $320,000
Weighted average simple payback 2.9 years
Low-cost control improvements delivered:
12 per cent savings
Under 12-month payback
Capital upgrades focused on:
HVAC plant optimisation
Variable speed drives
Demand control
Heat pump hot water replacement
The key outcome was not just a list of savings.
It was a staged plan aligned to maintenance cycles and capital budgeting.
What Decision Makers Actually Use
Across multiple audits, the most frequently used sections are:
Executive summary
Opportunity register
Capital staging plan
Financial summary table
Detailed appendices are important for engineering validation.
But decisions are made from structured, commercial clarity.
If you are reviewing an energy audit provider, ask to see a de-identified sample report. You should be able to quickly identify:
Clear baseline
Clear savings register
Clear capital requirement
Clear prioritisation
Clear financial treatment
If it reads like a technical thesis, it will not drive action.
If you want to understand the broader scope of commercial and industrial energy audits in Australia, this guide explains what is included and how they are structured.
For details on audit levels under AS/NZS 3598, see our breakdown of Type 1, Type 2, and Type 3 energy audits.
If you want a clearer view of deliverables, see what you receive from a commercial energy audit and how reports are structured for decision-making.
Next Step
We can review your energy spend, site constraints, and budget cycle to determine whether a Type 2 or Type 3 audit is appropriate. We are also avavible If you would like to see what a decision-ready energy audit report for your site would look like
The goal is simple.
Give you a report that supports real operational and capital decisions.
Find out about available energy reduction grants and subsidies for your organisation on our Grants page.