
Turning Energy Audit Data Into Actionable Insights
Most commercial and industrial sites already have energy data.
Interval electricity data. Gas bills. BMS trends. Submeter readings.
The problem is not access to data. The problem is interpretation.
An energy audit converts raw data into decisions. That shift is what separates reporting from action.
This article explains how audit data becomes operational and financial insight across your site.
What facility managers are actually dealing with
For most facility managers, the data problem is not abstract. You are managing an ageing HVAC plant, coordinating contractors around operational windows, and trying to justify maintenance spend to finance teams who want numbers, not anecdotes.
Budget pressure means capital decisions get deferred. Breakdowns get reactive attention. Efficiency sits lower on the list until a bill spike forces it up.
The frustration is common: you have interval data, BMS logs, and maintenance records, but no structured process to connect them into a clear picture of what is costing you money and what should be fixed first.
That is exactly what a structured energy audit addresses.
From data to insight. What changes.
Raw data tells you what you consumed.
Audit insight tells you:
Why did you consume it
Where it is occurring
Whether it is controllable
What is the financial impact is
What should be done first
That translation process is where commercial value sits.
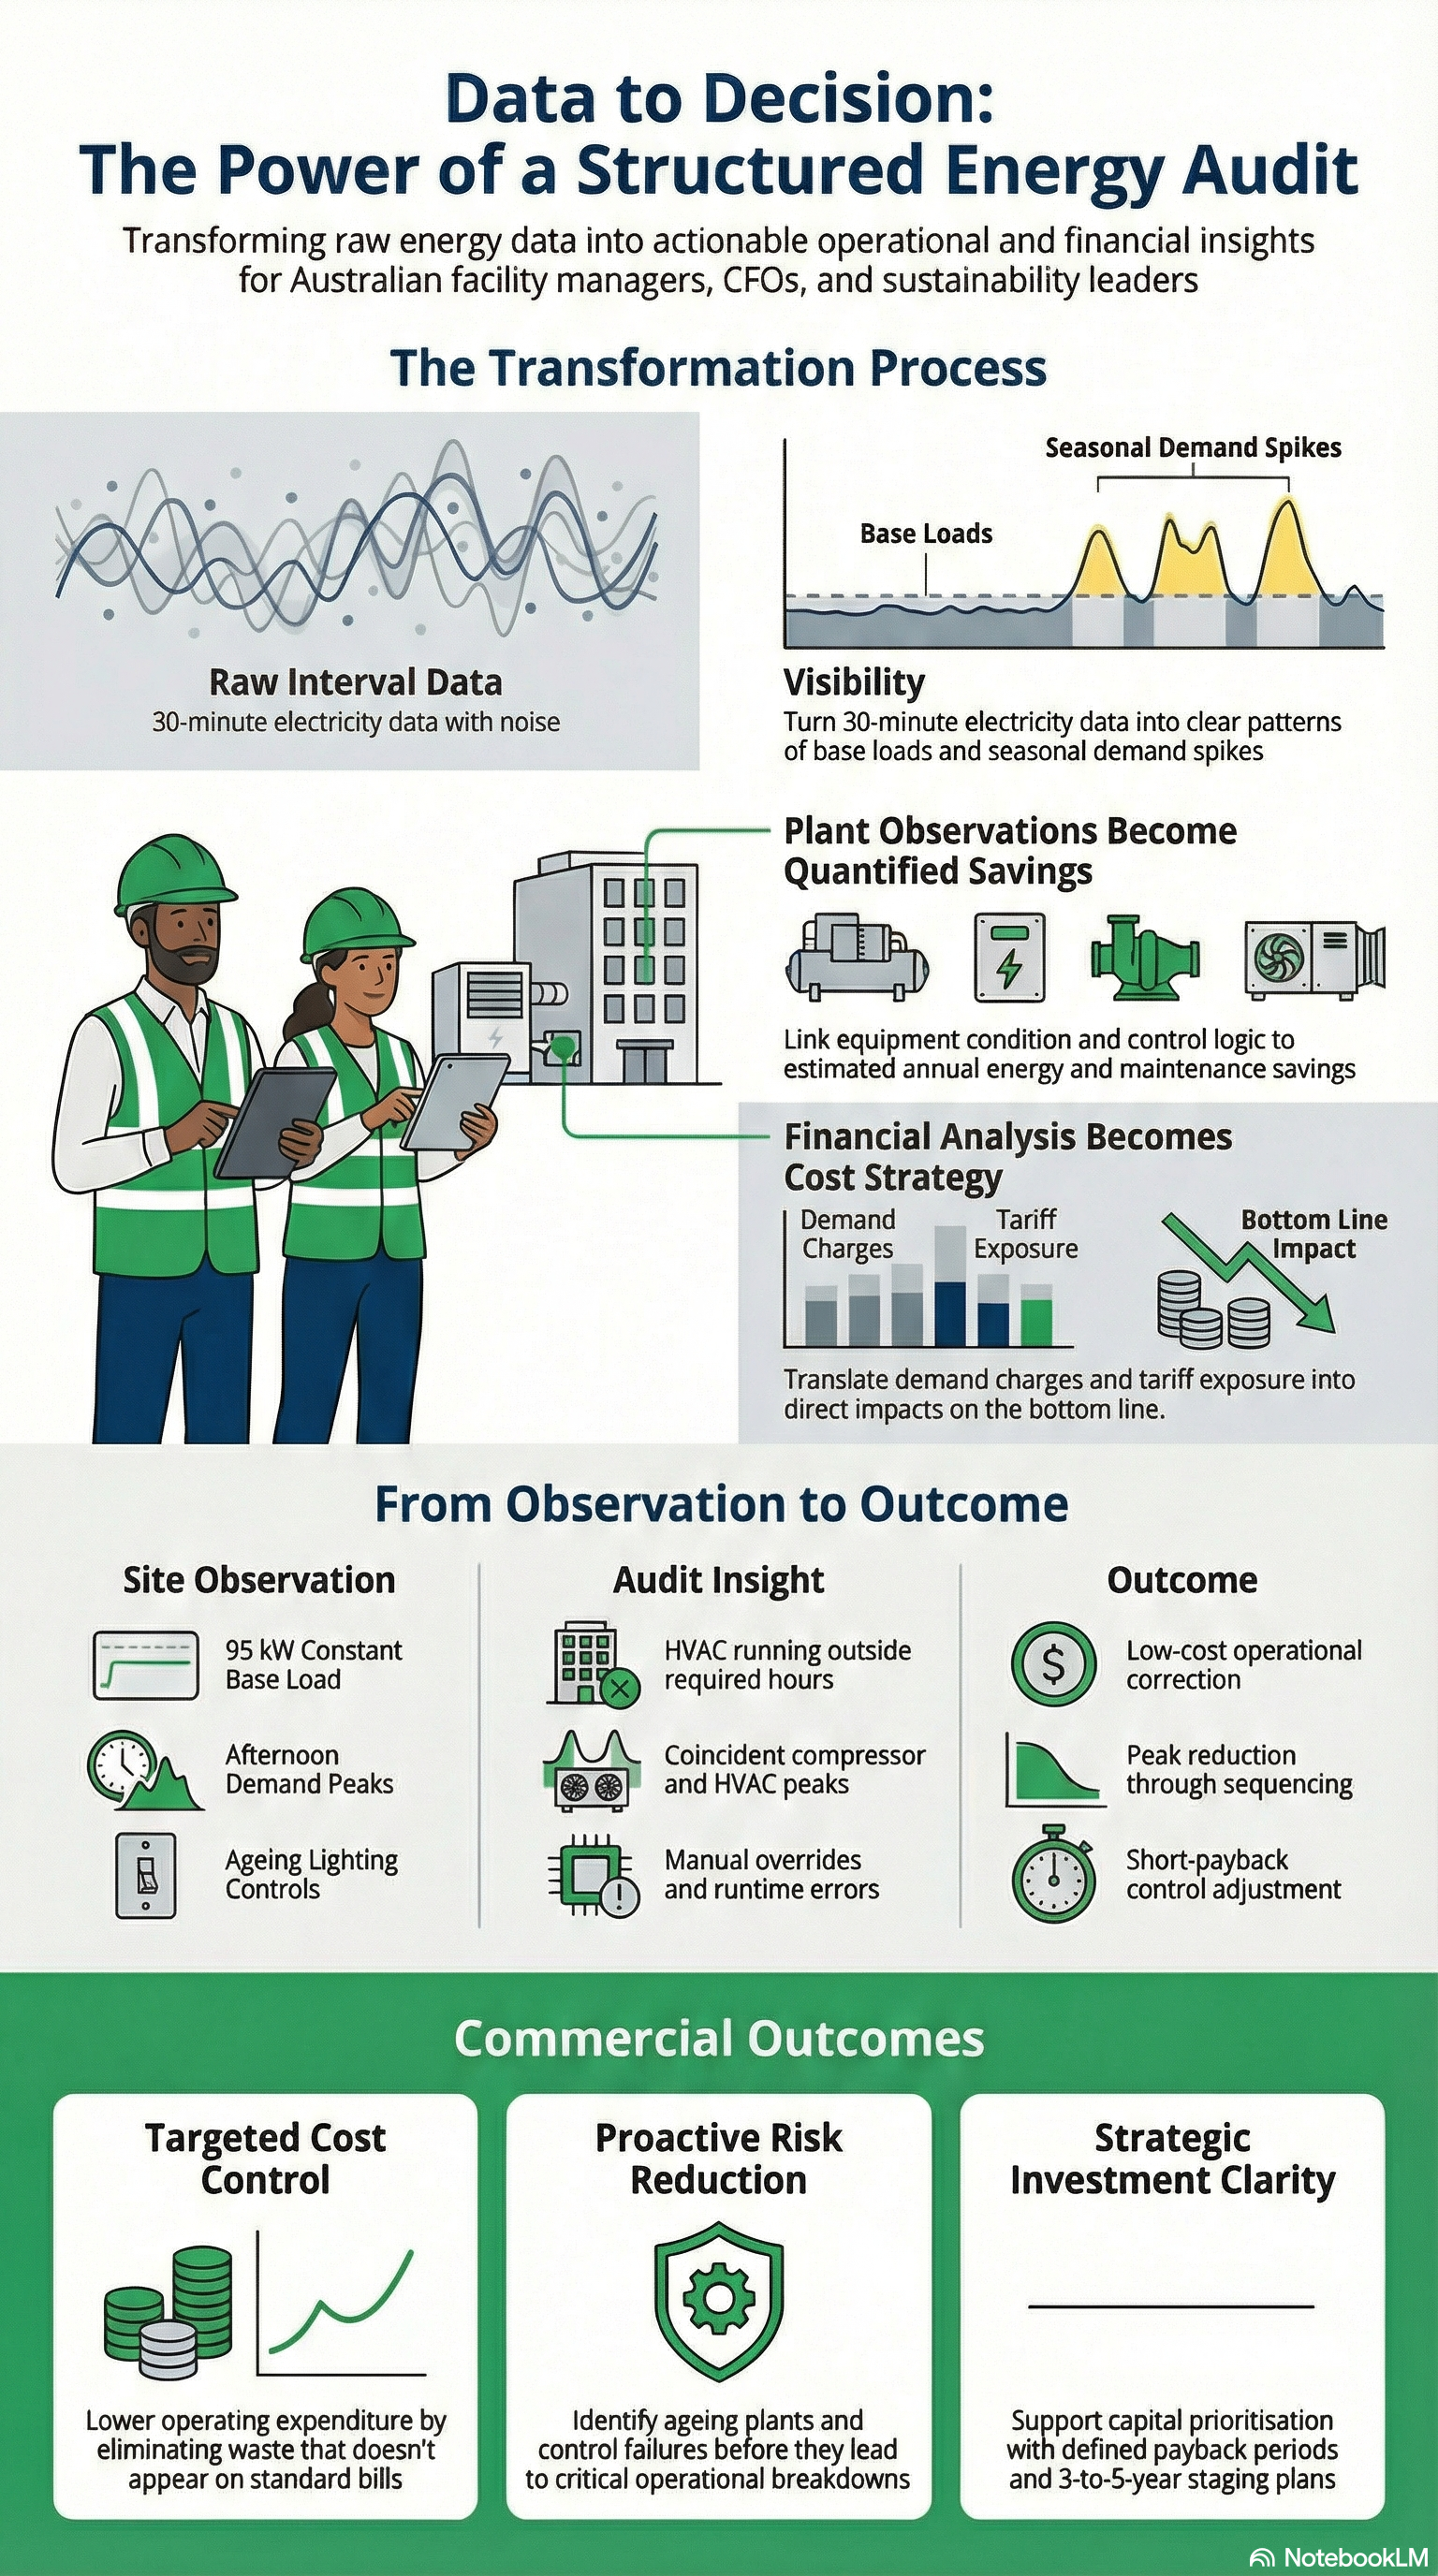
Interval data becomes operational visibility
Most large sites operate on 30-minute interval electricity data.
On its own, this data is a spreadsheet.
In an audit, it becomes:
Base load identification
After-hours energy patterns
Weekend consumption analysis
Seasonal demand spikes
Tariff exposure review
Indicative example
A mid-sized commercial site with an annual electricity spend of approximately $480,000 showed a consistent overnight base load of 95 kW.
After correlating interval data with plant schedules and site walkthrough observations, the audit identified:
HVAC running outside required hours
Car park ventilation is left continuous
Hot water circulation pumps are not temperature-controlled
None of these appeared on the electricity bill.
The insight was straightforward. The site was paying for a 24-hour operation in a building used for only 14 hours. That insight becomes a low-cost operational correction with short payback.
Plant observations become quantified savings
During site inspections, audits identify equipment condition, control logic, and runtime patterns.
Typical findings include:
Oversized chillers short cycling
Air compressors running unloaded
Ageing lighting controls overridden
Boilers operating at fixed high setpoints
On their own, these are technical observations. When linked with interval data and operating hours, they become:
Estimated annual energy savings
Demand reduction potential
Maintenance risk insights
Capex timing signals
If you want to understand what is typically included in the report that captures this detail, refer to What You Receive From a Commercial Energy Audit.
Tariff analysis becomes a cost strategy
Energy data is not just operational. It is financial.
An audit reviews:
Demand charges
Time of use exposure
Network tariffs
Power factor penalties
For CFOs and asset managers, this is where energy data connects directly to operating expense.
Indicative example
An industrial site with high afternoon peak demand was incurring elevated demand charges.
Interval review showed that coincident compressor and HVAC peaks were driving the issue.
By sequencing compressor operation and adjusting chilled water pre-cooling, peak demand could be reduced without capital investment.
That is not an energy efficiency measure. It is cost control through operational sequencing.
For finance leaders, similar logic is explored further in Energy Audits for CFOs. What the Numbers Mean.
Portfolio data becomes capital prioritisation
For asset managers and sustainability leaders, audit data supports portfolio decisions.
When multiple sites are assessed consistently, you can:
Rank sites by energy intensity
Identify the highest cost per square metre
Flag electrification-ready assets
Identify grid-constrained sites
Stage capital over 3 to 5 years
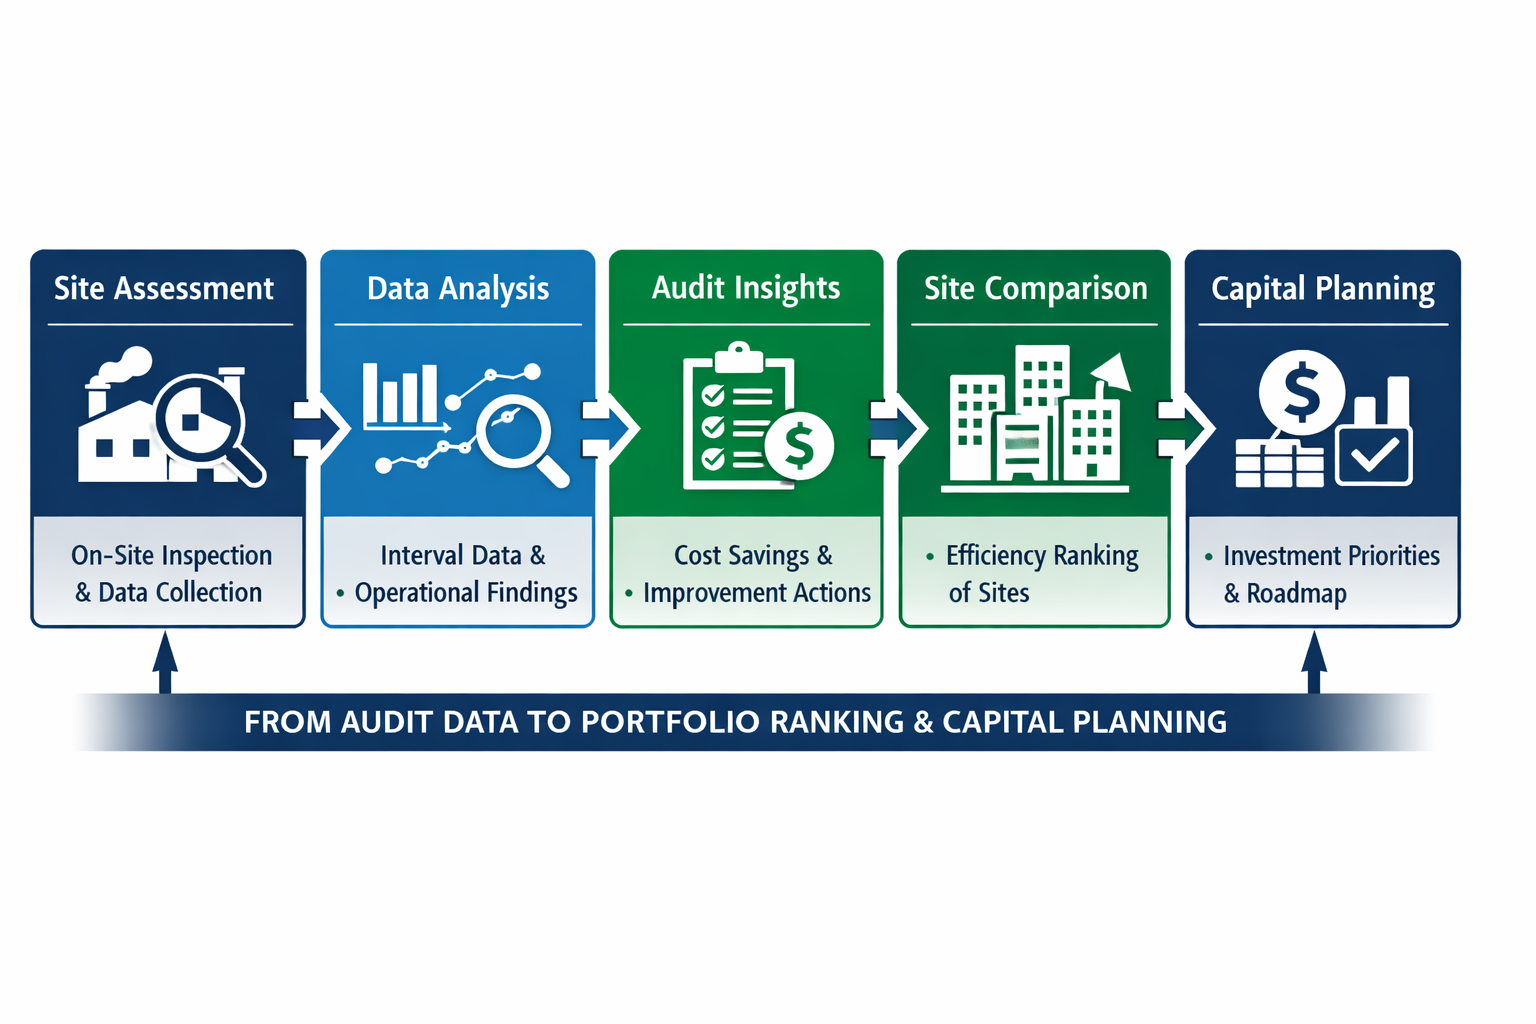
This moves the conversation from isolated projects to structured investment.
Energy audits are often the baseline for decarbonisation roadmaps and staged electrification planning.
If you are exploring how audits support broader decarbonisation upgrades, see Using Energy Audits to Prioritise Decarbonisation Upgrades.
Insight becomes action when responsibility is clear
Data only becomes actionable when it is assigned.
Strong audit processes translate findings into:
Clearly defined actions
Estimated savings
Capital cost ranges
Payback periods
Risk considerations
Suggested sequencing
For facility managers, this supports day-to-day scheduling corrections and maintenance alignment. For operations managers, it clarifies production impacts and reliability trade-offs. For CFOs, it supports budgeting and approval logic. For sustainability managers, it forms the emissions baseline and improvement pathway.
The commercial impact
Turning energy data into insight delivers three outcomes:
Cost control. Lower operating expenditure through targeted actions.
Risk reduction. Identification of ageing plant, control failures, and operational inefficiencies before breakdown.
Investment clarity. Capital allocated to measures with defined return and operational benefit.
Without structured interpretation, energy data remains noise. With a disciplined audit process, it becomes a decision tool.
The next step
If you are sitting on interval data, plant reports, and energy invoices but lack clarity on what to do next, a structured commercial energy audit converts that information into a prioritised action plan.
If you would like to understand how this would apply to your site, request a commercial energy audit or speak with us to discuss your operational constraints and objectives.
Find out about available energy reduction grants and subsidies for your organisation on our Grants page.